Alberto Cairo | Infographics and Data Visualization
Alberto Cairo’s course on Infographics and Data Visualization (JMM622) is not your typical course. Professionals from all over the campus are beginning to take the course and use Infographics and Data Visualization. These graphics are often used in their publications and at conferences to communicate to the public. It just depends on the purpose of the graphic display. As Cairo describes it, Infographics and Data Visualization are evidence-based driven communications with the goal of improving people’s lives. This technical solution is something he hopes that more faculty will begin to incorporate into their materials.
Instructor’s Perspective
Cairo has taught graduate and undergraduate versions of his course (JMM331/ JMM622) and focuses his courses on the communications side or journalism. He helps students understand and effectively use the principle behind the design and development these graphics. Professionals from everywhere on campus take the class to become better communicators.
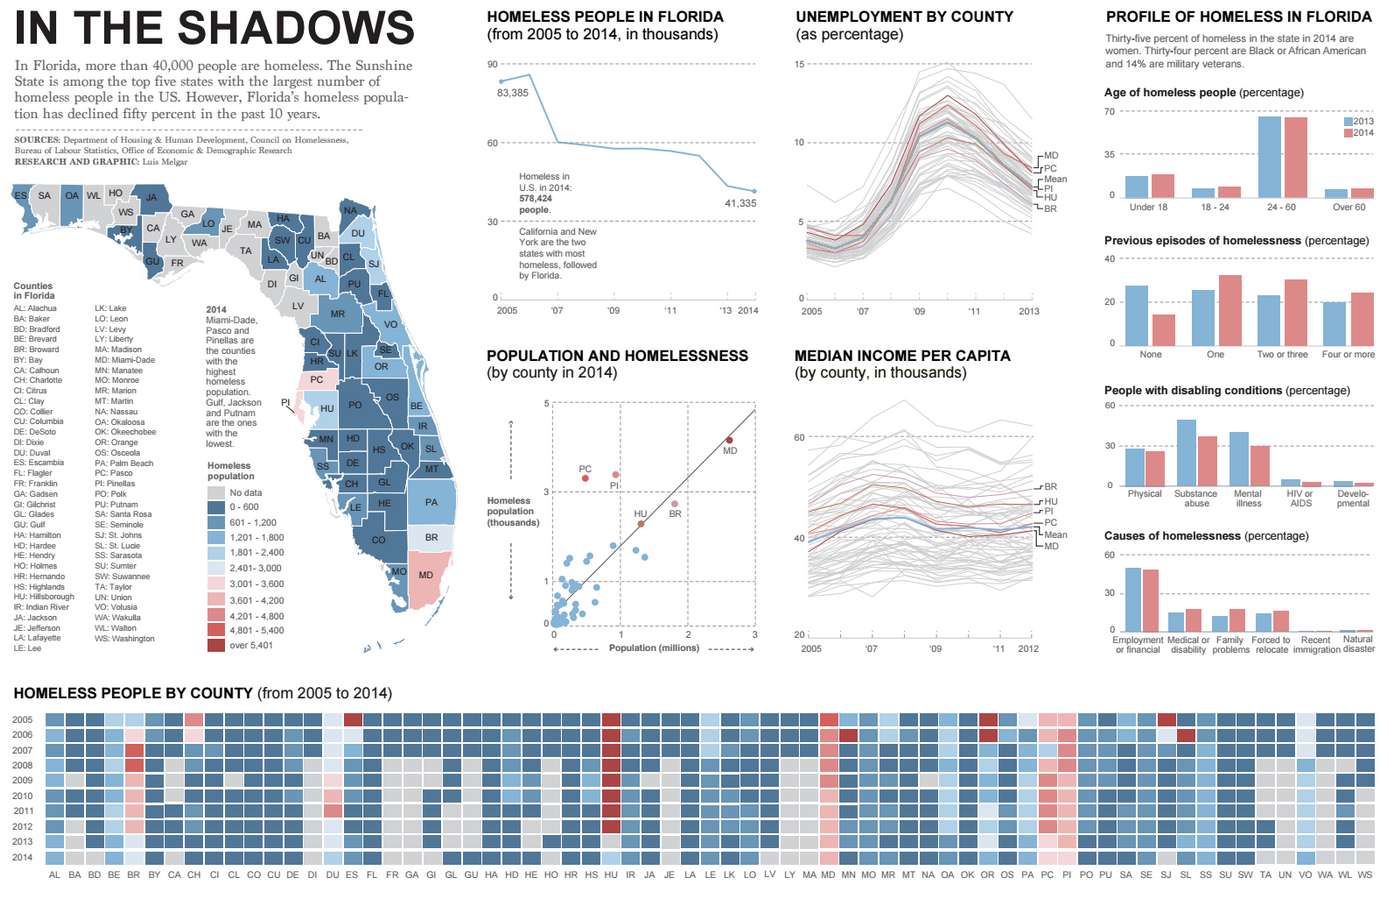
Cairo describes the development of Infographics and Data Visualization as journalism. As an example Cairo once lived in Brazil and while reading the newspaper, discovered the work of a young computer science student. This student had gathered publicly available data to represent flood data through an infographic. The student wanted to describe what had occurred during the catastrophe. As an undergrad he had found data that was only found in tabular form and transformed it into maps and charts that described the flooded areas. He did so to help improve people’s lives. Even though this student was not a professional, Cairo says he “committed an act of journalism!”
Cairo decided to develop a class from that student’s experience, with the goal of multiplying that act to benefit the public. He describes journalism as an activity that anybody can conduct. Also the design and development of graphics is a skill, like language, that may be applied to many disciplines. In business this is known as Business Analytics, or Business Intelligence. Scientist use these techniques for scientific data visualization or to allow the user to explore data.
Students are taught to develop materials that are concise and compelling, and to transform data into beautiful charts, diagrams, and maps. The classes are small, with about 20 students in each section this fall. However Cairo says the course has been quite popular, with two sections of graduate and two sections of undergraduates just to meet the demand. The course is taught every semester.
Students will use tools like Photoshop or Illustrator, but Cairo follows the philosophy that tools are just a means to communicate. Although he encourages the use of tools, his course is really about the principles of visualization. He explained that he teaches students when it is appropriate to use a bar or line chart, and that there is an enormous variety of graphics for communicating information. Each is appropriate depending on the goal in mind, and depends on a series of rules or principles of visualization to communicate through visuals and text. This growing field is grounded in human vision and perception. As an example they consider the proper uses of type, effective uses of fonts and color.
Video: Alberto Cairo presented during the meeting 'Chicas Poderosas Miami' a few tips for who want to show their data in a more effective and focused way.
As Cairo describes it his class is about the display of information and while students often want to produce displays that make data beautiful he says that’s not the place to start. His approach is not to focus them on the development of “eye candy.” If students focus on cool or beautiful products then they are doing it wrong. So intentionally he does not focus on aesthetics. Quality comes first, so it’s also important for designers to double-checked the data, and provide products with structure and substance. This is the difference between news and infotainment.
Student products need to be elegant, well designed, but his main goal is not to create pretty graphics. The goal is to inform the public clearly without over-simplification. According to Cairo over-simplification implies reduction, which is not his goal. The thought is that students need to clarify information. Viewers may need a large amount of information for them to develop a good mental model.
When asked what he would say to a colleague who is thinking about using data visualizations or infographics techniques, he suggested that professionals should consider developing a good sense of the elementary principles. That they should learn about when to use visual displays like a line graph or bar chart. Each has a purpose and only should be used when it is appropriate
Finally he suggested people should start by reading; learn about one of the many tools that are out there and how to use them well. For instance he mentioned a free online tool available on the web at Quadrigram.com. This tool is good for data visualization and is a free tool for data driven graphics.
He also proposed that “Learning to apply principles well, takes longer than using the tool” it is like learning to write and can take years. The tools of language can be applied in different ways to create different structures within stories; it is similar with infographics.